← Solutions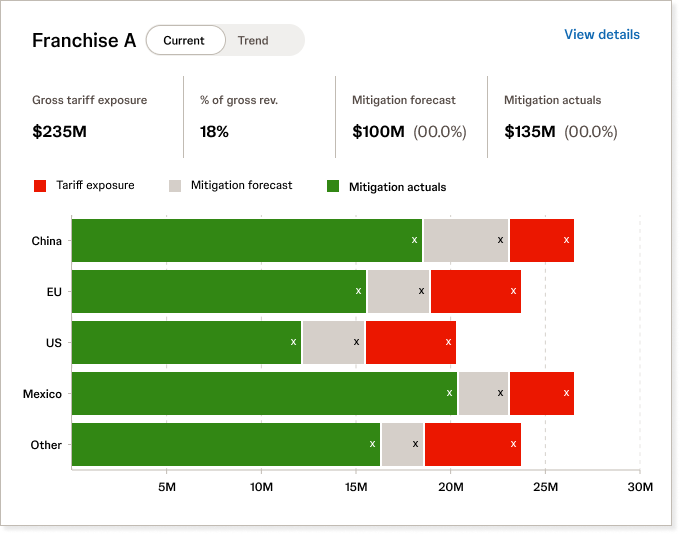
Helping Business Leaders visualize tariff impacts on their network and mitigate risks
In light of new tariff policies, a global corporation needed help visualizing how tariffs were currently mitigating their network and identify opportunities to further mitigate where there was opportunity.
- Role
- Lead
- Year
- 2025
Approach
We ran interviews with Finance and other business leaders to develop a PowerBI dashboard to visualize tariff impacts across their network. We worked closely with development to overcome data and UI limitations.
Result
A comprehensive PowerBI application that can be used to visualize tariff impact. Lessons: PowerBI has a lot of limitations in terms of what can be done with it. Understanding these constraints and working with developers is helpful to make sure that what can be delivered can actually be built.